 |
HIW |  |
Table of content
HIW
is an app to monitor and manage all body sizes/measures of children during their
growth phase (age of 0-18 years) and includes data for height, weight, head girth, skinfolds, hip and waist circumference as well as for blood pressure.
Additionally the body mass index (BMI), waist/hip relation, waist/height relation and body fat get
automatically calculated.
All Measures and values get displayed graphically for comparison with reference data (percentile plots).
The reference material is based on data acquired in Germany by the
Robert Koch Institute (RKI). Hence, the program is mainly intended for people from Germany and its neighbouring countries.
The reference material is a cruicial factor. Other
programs usually use data obtained from the WHO or other sources. These data actually differ from the data acquired from the Germany population.
If you are - say - Indian living in India the reference material used here is not suited for you, but if you are - say - Dutch living in the Netherlands the
reference material will probably match pretty well.
This app complies to highest standards for privacy and confidentiality. Hence, the program does not contain any advertizing and does not send any personal data
to some remote servers.


 Wechseln zur deutschsprachigen Version.
License
For Android this app is exclusively obtainable from the Google Play Store and
is available as
demo version (free of charge) or as
full version
for 1.19€ (incl. VAT. If another price is listed at the Google Play Store that price listed there is
valid, final retail price may vary on location.
The demo version for Windows and the full version for MorphOS are distributed as freeware and may get freely distributed as
archive. The archives must not get changed though!
Usage of this software is on own risk. This software is absolutely not a
replacement for consulting your paediatrician! No warranties given.
System requirements
- Android: 2.3 or better
- Windows: XP, Vista, 7, 8, 10
- MorphOS: any version
Installation
Android: By downloading from the Google Playstore installation process starts automatically.
The app requires network access (for version checking and online help), as well as access to the
file system (user data must get stored and loaded).
User data or any other other/third files will never get sent to any server
Windows: After unzipping the zip-archive program fle may get copied to any location. There is no special installation process required.
MorphOS: After unpacking the lha-archive the program fle may get copied to any location. There is no special installation process required.
Usage
After program launch the main menu appears. There are two major areas:
On the left there is the data management and on the right the data evaluation (i.e. the diagrams).
In case the program has not started up with your preferred language tip/click on the three gray
dots at the top right to open a menu and chose your desired language then (currently available: English and German).
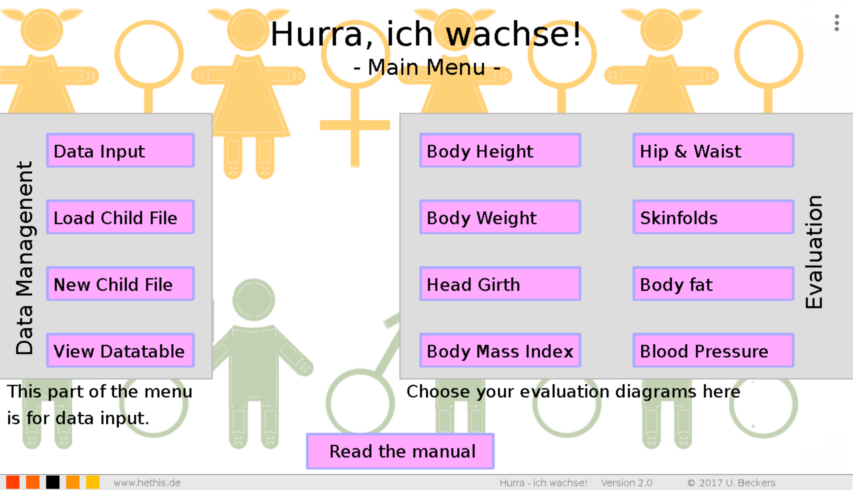
If there is no data set created for a child yet, this can be done by pressing on the button "New Child File"
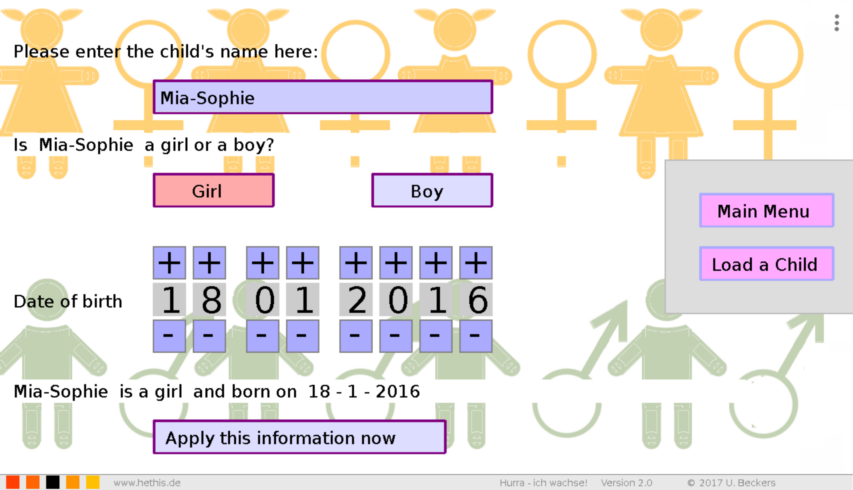
(the app does not need a child's data set for general usage though). Please click or tip
on the input field at the top are (the grey field with the purple edging) and type in the
name. You may finalize the input by hitting te enter key or by clicking/tipping anyway
outside the input field. Then choose the child's sex and enter
the date of birth and finally tip/click on the then appearing "Apply this information now" button.
A data set with the child's name and the file extension
".hurra" gets created and sored within the program drawer. If there is a
fle with identical name already, the name simply gets extended with an underscore _. Unintended overwriting
of an existing file gets avoided this way.
The app then jumps automatically to the further data input section.
If there are date files existing for one or several childs you can load these data sets
by hitting the button labeled "Load Child File". The files are named by the child's name extended with
".hurra" (an example of a data set is obtainable from the download section
) and are stored within a drawer called "Hurra".
This drawer is locacted as subdrawer within the program drawer.
Once a data set of a child has been loaded, you can edit or put in new data like body height, weight or
bloodpressure if you hit the button called "Data Input".
Editing of values can be done by using the + and - buttons.
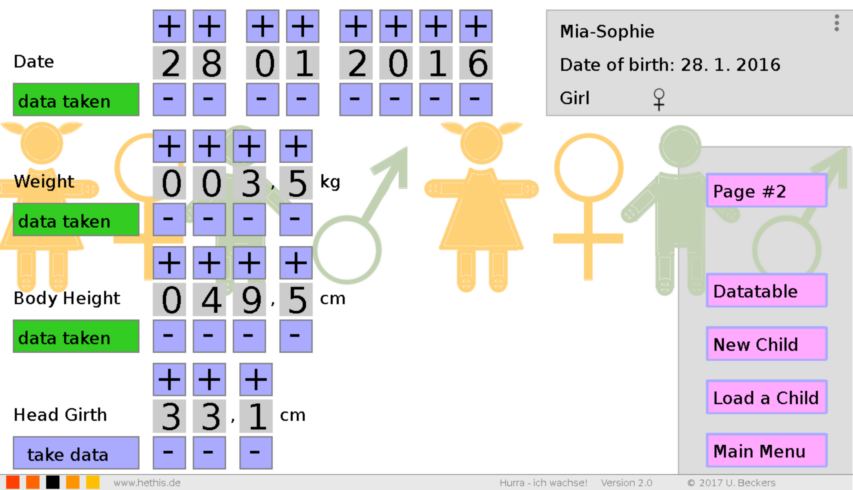
At first you should edit the date of the values you want to type in, once done, hit the button
button "take data" to save the data. If a data has been taken, this gets indicated by the button
which then gets green and is showing "data taken".
Now you can edit more measures for this date. Each input must get confirmed with the button "take data"
for saving. Please mind the units of the different measures.
The button "Page 2" proceeds to the input fields of the waist and hip measures as well as for
skinfolds and the blood pressure.
Data Evaluation
With the buttons at the right side of the main menu different evaluation diagrams can get selected. If there's no actual data set of a child is loaded a percentile diagram for either girls or boys aged up to 24 months gets shown. For reasons of a simple discernibility the background is coloured in light-pink for data of girls and in a pale-blue for data of boys. If a child's dataset is loaded, the app selects automatically the according reference data and period, also the child's name gests displayed. Of course the data of a child can get displays in all other percentile diagrams, just select the according button on the right side.
Data of a child gets displayed by red dots within the diagrams while the reference data gets plotted as curves where blue denotes the median values, purple the P93 and P3 values, dark grey the P75 and P25 values and light grey the P90 and P10 values. This is also noted within the caption of the diagrams. By tipping on a caption item a short explanation box pops up for a brief time. The reference curves illustrate the statistical distribution of the measurements. The median (middle value) denotes the value separating boths halfs of the reference values. I.e. exactly one half of all values is below and the other half is higher than the median value. The P-values denote the percentage of all values below this value. For example the P10 curve shows all those values where exactly 10% of all values (i.e. each 10th value) are lower than these, or respectively where 90% are larger. The index numbers of the other P-values are indicating the according other percentages.
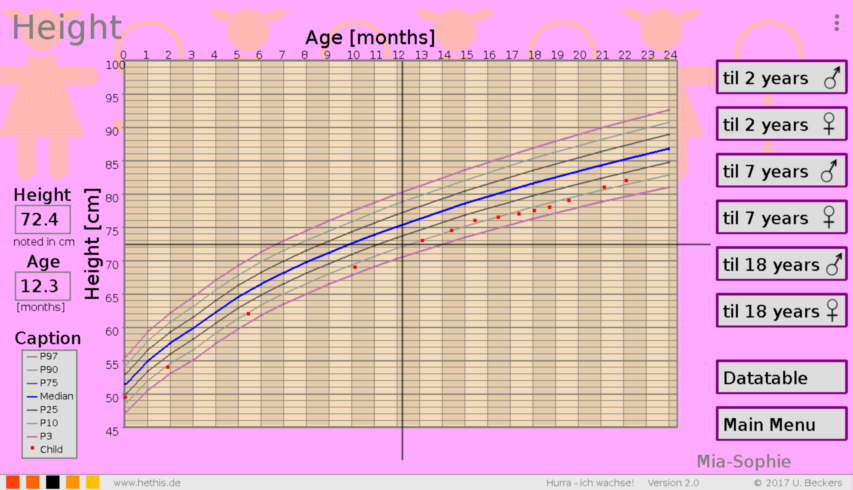
In the example display shown here the data (red dots) of
"Mia-Sophie" is about the values of the P10 refefrence.
"Mia-Sophie" thus belongs to about the smallest 10% of girls of her age peer group.
With the black sliders (the a bit thicker black lines which overtop the diagram on the right hand and at the bottom)
it is possible to read any value within the diagram clearly displayed.
These get displayed as digit output on the left side of the diagram. To move the sliders just tip (androd) or click (Windows/MorphOS)
at the overtoping area of he slider and move it to any position you like.
Data for the body mass index (BMI) are calculated automatically if weight and height measureas of the same calendary
date are available. For calculation of the body fat percentage it's similar: here measures of the
triceps and back folds are required at the same calendary date. For measurement of skin folds a caliper tool is
required.Calculation of the body fat percentage requires a minimum age of 8 years.
Please note that for hip and waist measures reference data is available starting with an age of minimum 11 years on.
Reference data for the blood pressure is available for children aged 3.5 years minimum.
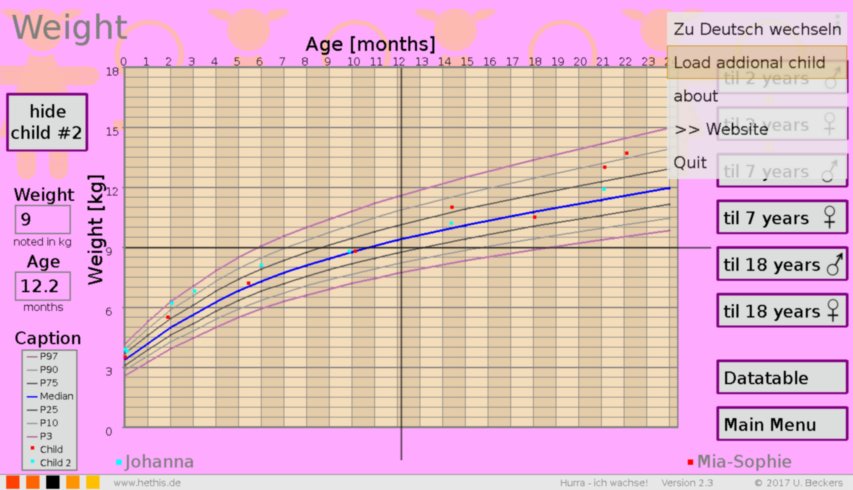
If you want to compare data or just view data from two children simultaneously, just tip/click
the menu at the upper right display edge (the three dots). Choose
"load additional child" from the menu and select the file of the 2nd child.
Data of this addidional child (at the shown example "Johanna")
is then shown at the diagrammes for body height, weight, head girth and BMI as additional
cyan coloured dots. If data of a second child has been loaded a button at the left upper part
of the display gets shown that lets you select whether the data of the additional child
gets shown or not.
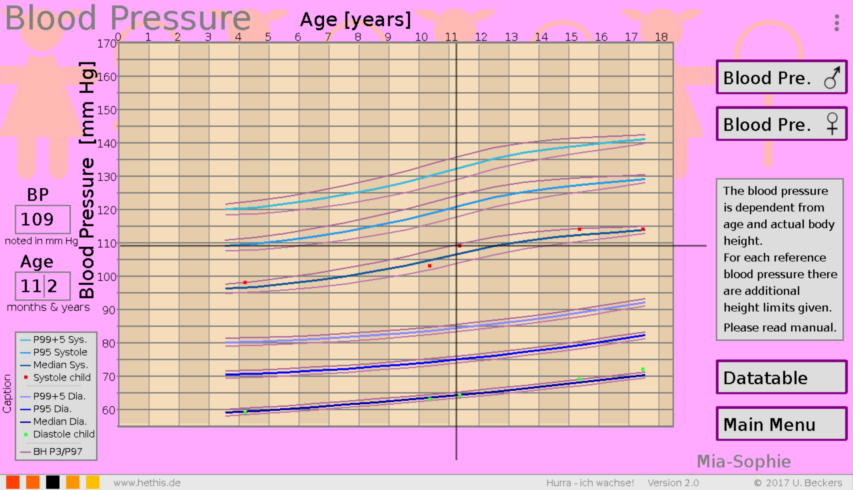
The blood pressure diagrams require, however, a bit more comprehensive explanation to understand correctly, since the blood
pressure does not only depend on the age, but also on the actual body height.
The upper three coloured curves show the reference values for the systolic blood pressure (i.e. the higher blood pressure value).
But in this case there are not the P3, P10, P25... values given, but the values for the median,
the P95 percentile and the P99 percentile plus 5mm Hg. I.e. this value is build of the measured
P99 value (the limit value that gets exceeded by only 1% of the reference data) that is additionally increased by another 5 mm Hg.
This "P99+5mm Hg" value is usually seen as the limit value for a 2nd grade hypertension
(severe hypertension).
Because the reference values are not only dependent from the child's age but also from the body height
each percentile curve is accompanied by two dark purple limiting curves: the "BH P3/P97"curves.
While the thicker blueish curves denotes the blood pressure percentile values with average (i.e. median) body height, the
dark purple curves show the blood pressure percentile curves for the P97 body height group (upper curve) and the P3 body height
group (lower curves) of each actual age.
An example: as can be seen from the figure a bit above showing the body height percentiles, "Mia-Sophie" is a rather
smaller child (body height of about the p10 percentile group). The systolic blood pressure (the green dot at 108 mm Hg) within the figure
at an age of about 11 years is located at the median curve of the systolic blood pressure, but must be seen as a small bit elevated since
Mia-Sophie has a rather small body height and for her the lower dark purple curve is the more relevant reference curve.
The lower thre curves denote the diastolic blood pressure values respectively.
By tipping on the caption entries a brief explanation for the values gets shown.
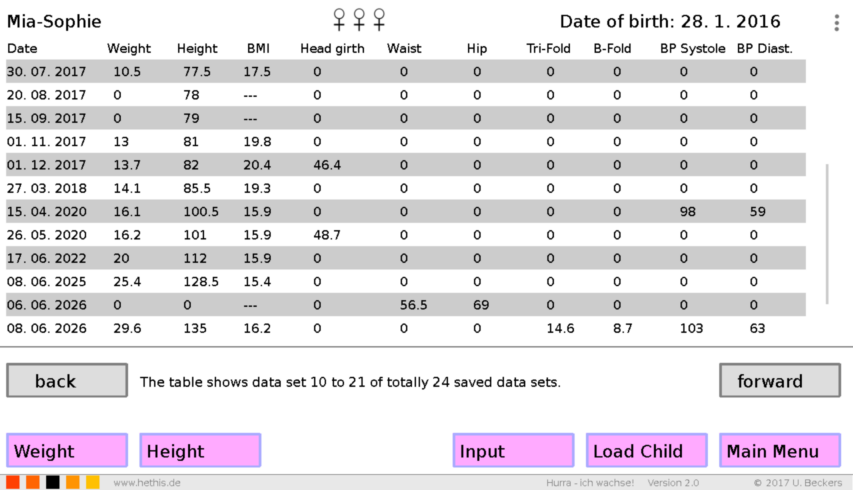
The menu item "Data Table" at the left bottom within the main menu you can view
all saved data as table sorted by calendary date. If the table consists of more than 14 calendary entries you can
easily scroll down the table by moving it directly with the fingers or the mouse. Additionally there is a scroll
bar shown at the right.
If you enterd a wrong measure you can edit this value at the menu item "Data input" if you enter the according calendary date.
If you want to erase the value just enter 0.0 and click on "take data".
The Android version is available via the Google Play Store as
full version or as demo version.
![]()
A demo version for Windows is
obtainable here.
The MorphOS version is
obtainable here as full version free of charge.
The AmigaOS version is
obtainable here as full version free of charge.
An example of a child data set can get
downloaded here (suggested for the demo version, mind the file extension when downloading/saving).
What are the limitations of the demo version?
The demo version is fully identical to the full version
but a persistant saving of data input limited to three data sets per child.
Why am I not able to enter any text?
With Android there may be problems with Swiftkey and text input. On Android 5 devices Swiftkey is not recomended for this app.
Why does Windows warn me that this program may be dangerous?
The program is not dangerous but yet it does not have a valid
identification certificate. Hence, this standard warning.
If you have any questions, feature requests or wishes, please don't hesitate to use the contact form.
References
Beiträge zur Gesundheitsberichterstattung des Bundes
Referenzperzentile für anthropometrische Maßzahlen und Blutdruck aus der Studie
zur Gesundheit von Kindern und Jugendlichen in Deutschland (KiGGS)
2. erweiterte Auflage
Robert Koch-Institut, Berlin 2013
ISBN 978-3-89606-218-5
Slaughter MH, Lohman TG, Boileau RA et al. (1988): Skinfold equations for estimation of body fatness in children and youth. Hum Biol 60 (5): 709-723
V2.3 released on 14-12-2017
-
- minor changes of the UI and localization
V2.2 released on 05-06-2017
- Fixed a bug on saving data
- Amiga version
V2.1 released on 01-05-2017
-
- Menu now with quit function
- some minor fixes
V2.0 released on 27-01-2017
-
-
-
- several minor fixes and improvements
V1.5 released on 07-01-2017
- improved graphic output
- many small fixes and improvements